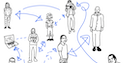
vis in public spaces
Data Crafting
Data physicalization for reflection, expression, and community.
related material:
[eurovis26]

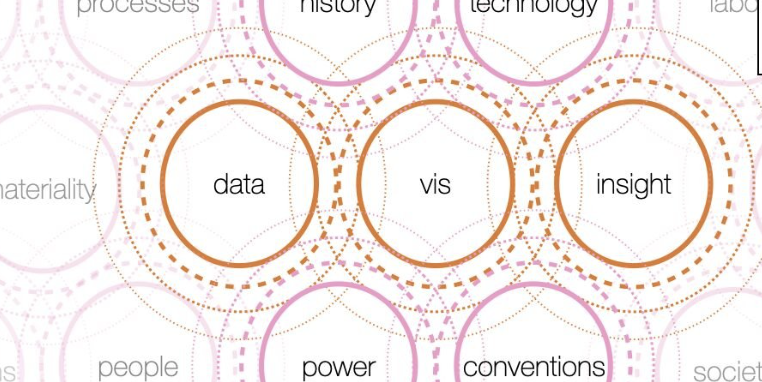
critical data visualization
Care-ful Design Study
Matters of care as an ethical lens on collaborative research.
related material:
[chi23]
Socio-technical Considerations of Dashboards
Transitioning to dashboards, and the socio-technical challenges it brings.
related material:
[vis23]
Data Hunches
Valuing personal knowledge in visual analysis.
related material:
[vis22] [plosbio22] [infovis18]
[demo1] [demo2]
Words Matter
Critique of 'chartjunk' as misaligned and inappropriate for vis research.
related material:
[altvis21] [website]

theories of visualization design
Feminist Visualization
Feminist and pluralist perspectives for visualization design research.
related material:
[chi26]
[vis24]
Traceability
Making visualization design research transparent and scrutinizable.
related material:
[eurovis26]

Rigor and Knowledge Construction
How visualization designers (can) construct rigorous knowledge.
related material:
[infovis20]
[infovis19]
[cga18]
Visualization Design Research
Models that describe what visualization design researchers do.
related material: [beliv16]
[infovis14] [iv13] [leo13]
[cga13]
[beliv12]
[infovis12] [visweek10]

methods for visualization research
Pair Interviewing
Method engaging two interviewers, rather than just one.
related material:
[vis23]
[primer]

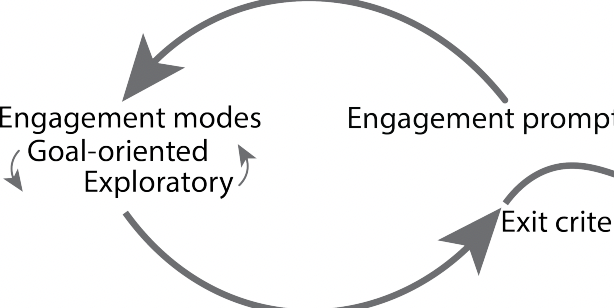
Data Engagement Interviews
Interview method for understanding visual analysis needs.
related material:
[imwut21]
[vis21] [materials]
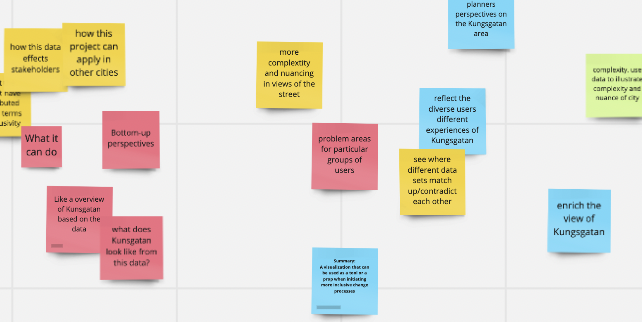
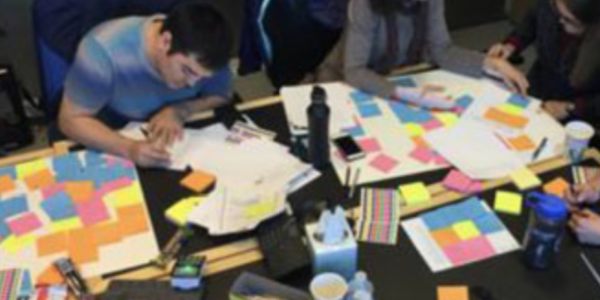
Workshops
Participatory design workshops for discovering visualization opportunities.
related material:
[beliv20]
[infovis18] [methods]
Making Data Visual
Practical guidance for translating data into insightful visualizations.
related material: [book18]
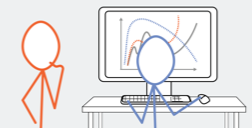
interview studies
Qualitative studies of how visualizations work in the world.
related material:
[vis-collaboration]
[dashboards]
[air-quality2]
[air-quality1]
[engaging-data]
[designers]

design studies
Projects that target specific, real-world, data analysis challenges.
related material:
[Trevo]
[ImplicitError]
[Graffinity]
[BubbleNet]
[WeaVER]
[Poemage]
[ShotViewer]
[PoemViewer]
[MulteeSum] [Pathline] [Mizbee]
visualization of personal data
The Personal Informatics Analysis Gap
Three-year study with asthamtic families that reveals
opportunities for visualization.
related material:
[vis21]
[imwut21]
[imwut18]
[lcn18]

AQ&U
Empowering citizens to reason about air quality using networks
of low-cost sensors.
related material:
[enviro20]
[envres20]
[imwut18]
[lcn18]
[cityvis18]
[website]

rapid prototyping with data
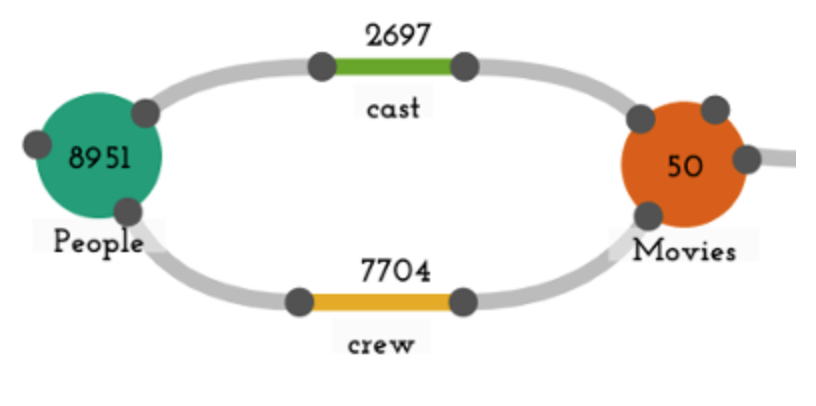
Reshaping Graphs
Tool for representing, reshaping, and reimagining data as a graph.
related material: [vast19] [software]
Iterating Between Tools
Model that describes how to bridge between generative and drawing
tools, and Hanpuku, a tool that bridges D3 and Illustrator.
related material: [infovis16] [software]
How Designers Design with Data
Results of a qualitative study that describe how designers use data and
existing tools to create infographics.
related material: [avi14]
digital humanities
Visualizing Poetry
Visual encoding of poetic devices for poets.
related material: [infovis15] [eurovis13]
software: [poemage] [poemviewer]
RhymeDesign
A formalism for analyzing sonic devices in poetry.
related material: [clfl15] [software]
visualization of biological data
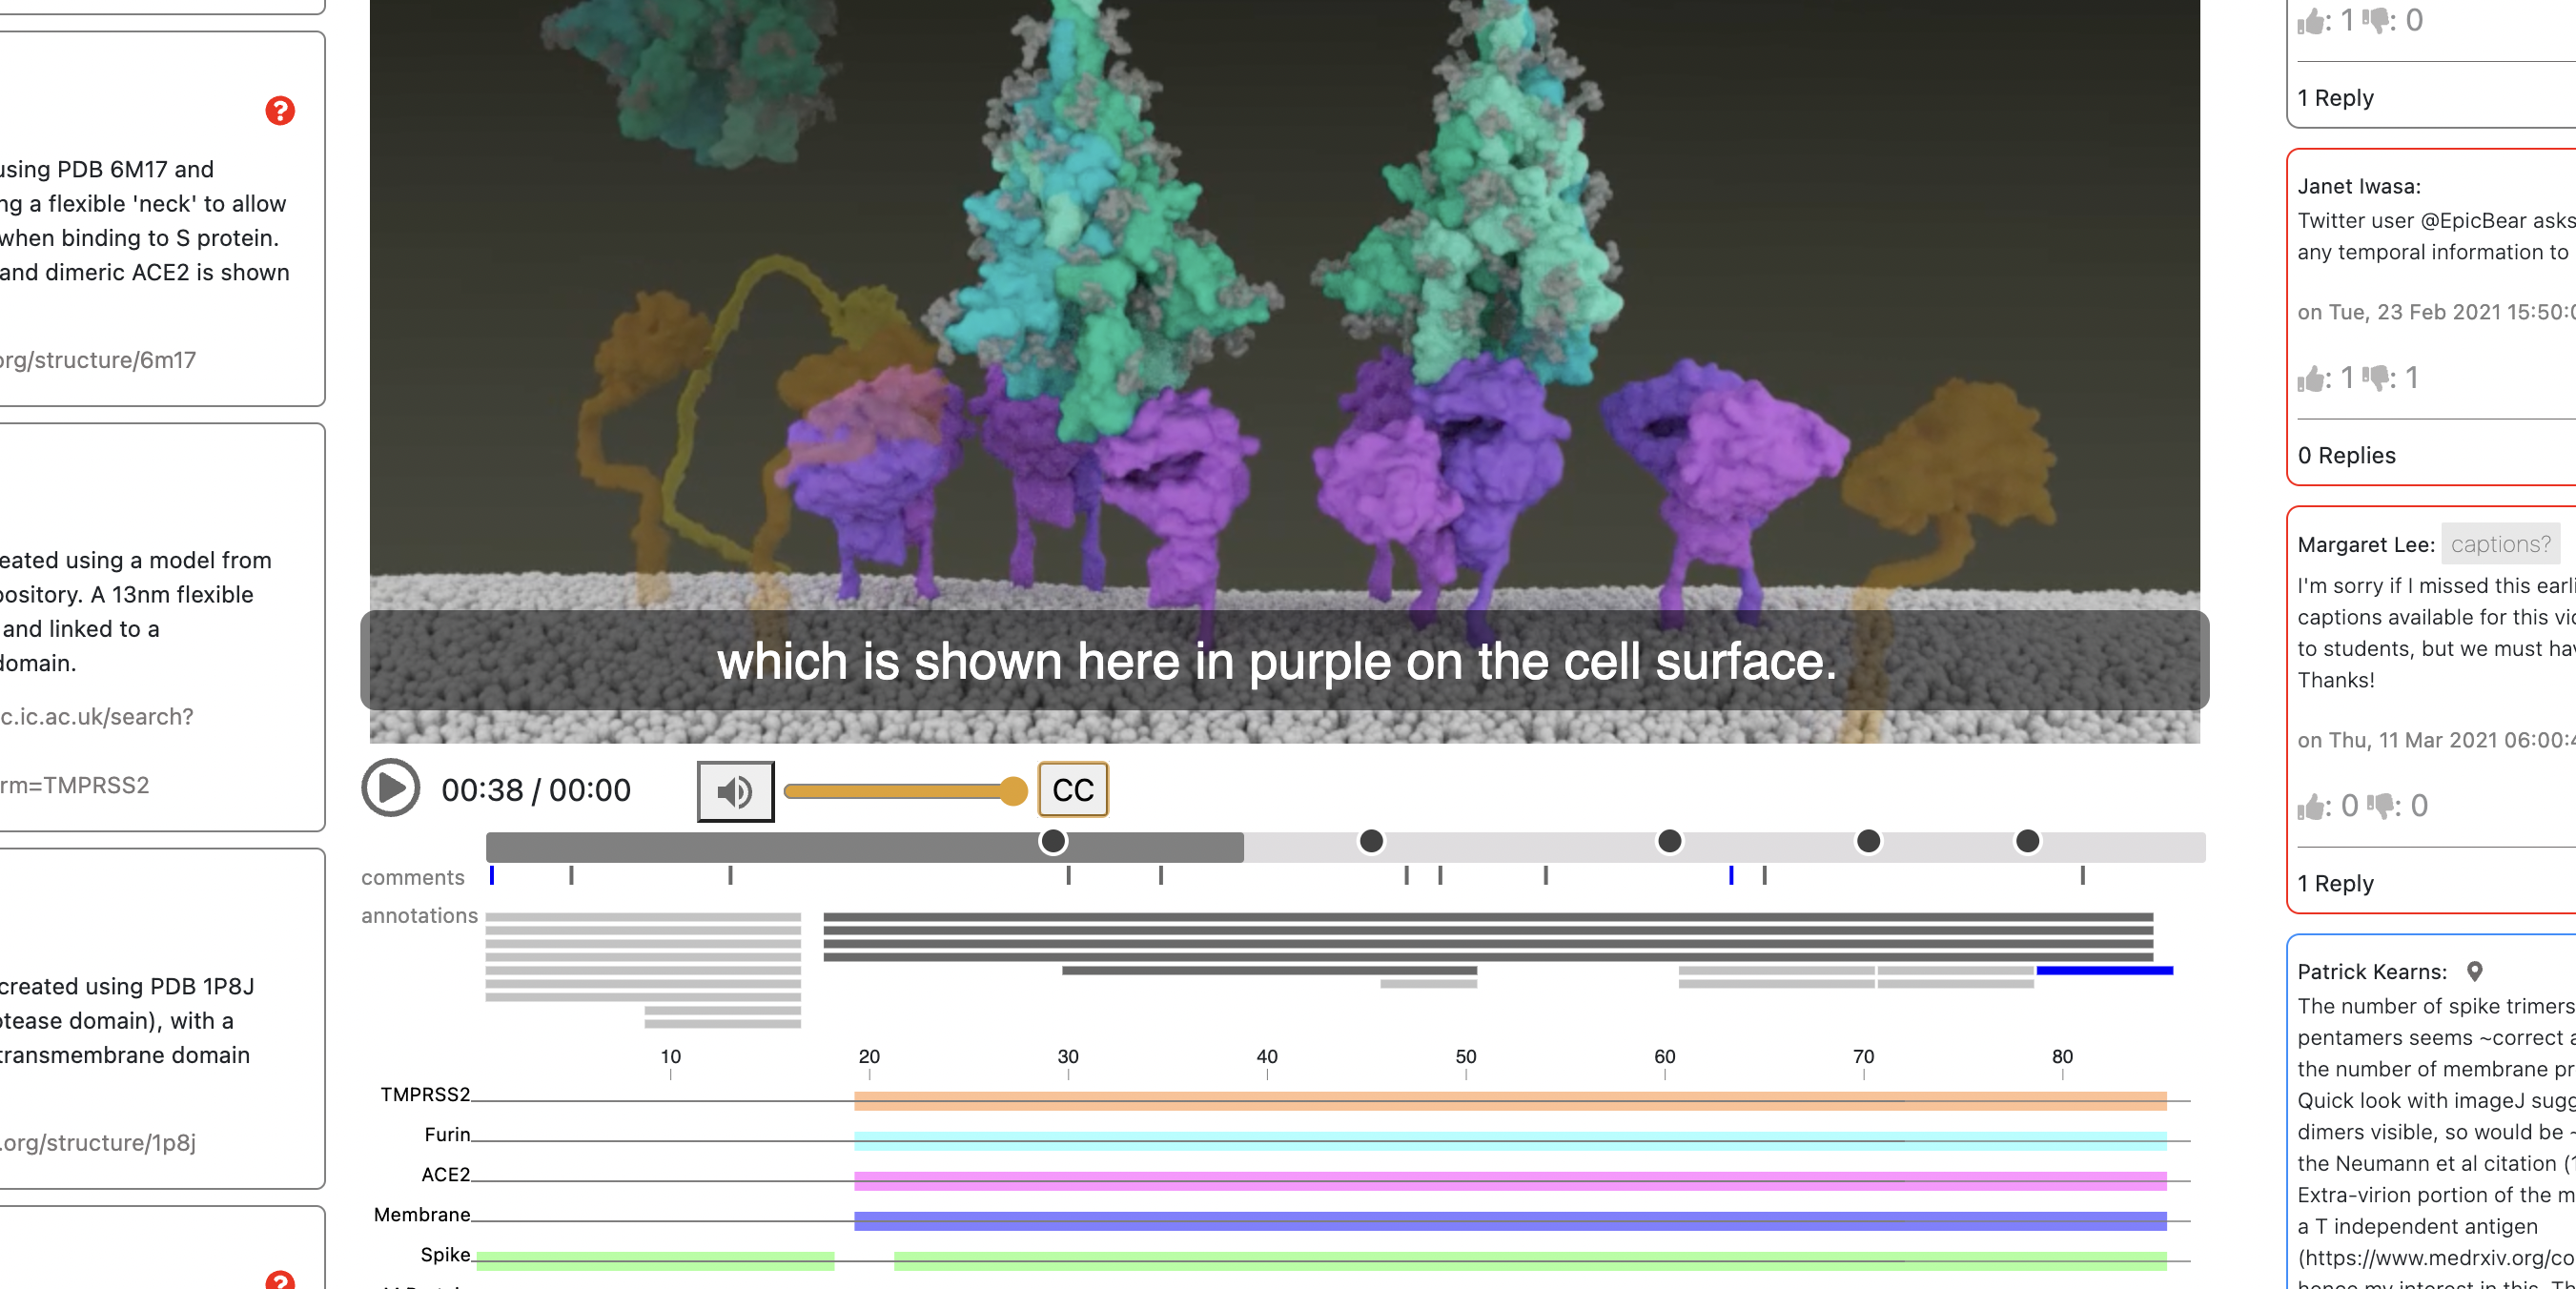
Supporting Consensus Model Building
Molecular animations + annotation mechanisms to support scientific dialog.
related material: [plosbio22] [demo]
inSite
Interactive viewer for comparing patterns of binding sites across multiple genomics regions.
related material: [software]

MulteeSum
Exploration tool that supports the comparison of multiple gene expression data sets defined both spatially and temporally.
related material: [infovis10] [software]

Pathline
Tool that visualizes temporal gene expression data over multiple molecular pathways and across multiple species.
related material: [eurovis10] [software]
MizBee
Browser that enables analysis of comparative genomics data through visualization across multiple scales.
related material: [infovis09] [software]

volume visualization
Volume MLS
Unified framework for ray-casting arbitrary volumetric datasets using the method of Moving Least Squares.
related material: [vis08]
Visualizing High-Order Finite Elements
Particle system approach to visualizing isosurfaces embedded in high-order finite element data sets.
related material: [tvcg07]

mesh generation
High-Quality Mesh Generation Using Dynamic Particles
Method for constructing high-quality isosurface triangulations of volumetric scalar fields using a particle system.
related material: [vis07]
Meshing Multiple Material Volumes
Strategy for meshing multimaterial volumes that explicitly samples corners, edges, and surfaces of material intersections.
related material: [vis08] [mrt08] [software]

dynamic particle systems
Sampling Surfaces with Particles
Robust and controllable method for adaptive sampling of implicit surfaces.
related material: [smi05] [dissertation]

gp-gpu
Computing Reaction-Diffusion
Approach for solving partial differential equations within advection–reaction–diffusion models using the GPU.
related material: [cvs08]